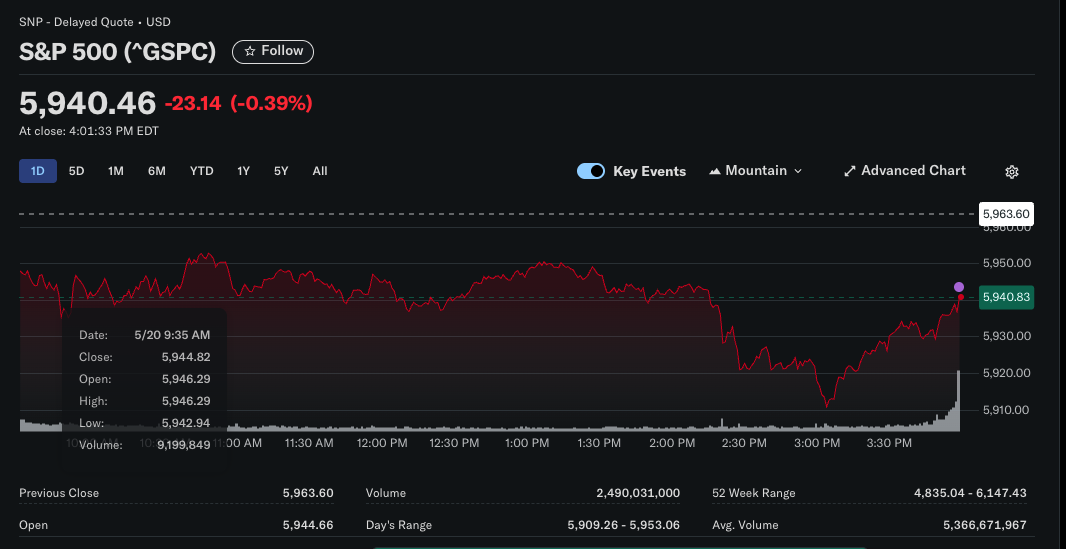
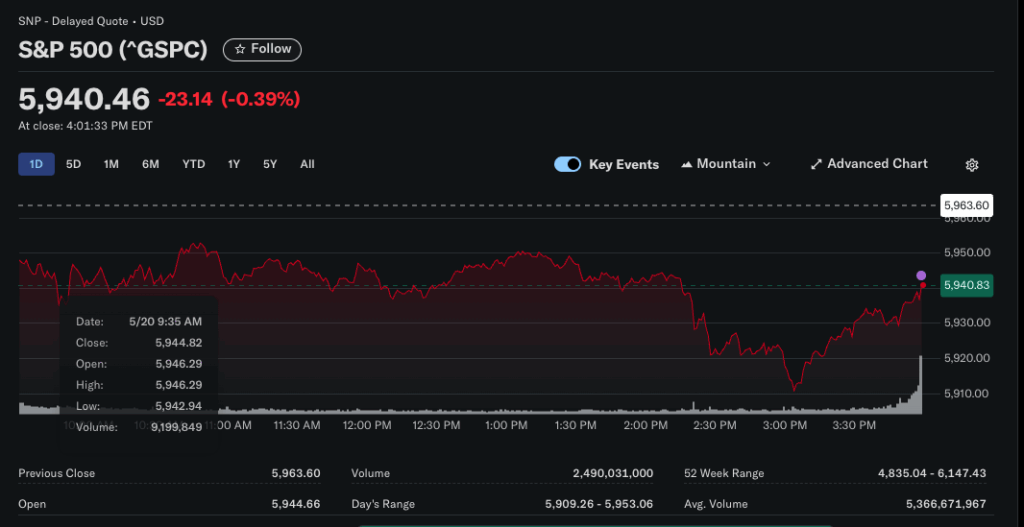
The S&P 500, a key benchmark for U.S. large-cap stocks, has shown remarkable resilience. Since its intraday low on April 7, 2025, the index has surged over 23%, with a six-day winning streak culminating in a close at 5,963.60 on Monday (May 19), reversing losses triggered by Moody’s U.S. debt rating downgrade. According to [Yahoo Finance: S&P 500 Index], the index now sits just 3% below its all-time high of 6,147.43, signaling potential for a near-term breakout.
Key drivers include easing trade tensions and improving investor sentiment. Notably, the U.S. and China agreed to reduce tariffs by 115 basis points during recent Geneva negotiations (valid for 90 days), as highlighted in Bank of America’s [Weekly Market Recap Report].
Bank of America’s Global Equity Risk Appetite Indicator
Bank of America (BofA) analysts note that its Global Equity Risk Appetite Indicator has rebounded from “deep panic” in early April to neutral levels. Strategist Ritesh Samadhiya stated that in 38 years of data, 32 out of 32 instances where the indicator shifted from panic to neutral saw markets either extend bull runs or form new ones. Only four cases saw sentiment relapse into panic.
Samadhiya emphasized: “Historically, improved market breadth post-panic phases under monetary easing has aligned with sustained bull markets.” While the indicator’s latest status isn’t publicly updated, BofA’s December 2024 year-end S&P 500 target of 6,666 (later revised to 5,600 in April 2025 due to tariff risks) reflects long-term optimism. Recent market stabilization may prompt upward revisions.
Other Institutional Forecasts and Technical Analysis
Multiple institutions project bullish near-term S&P 500 trajectories:
- Long Forecast: Predicts the index could reach 6,317 by May 2025 (a 5.93% gain from current levels) and 6,691 by June, surpassing the all-time high ([S&P 500 Forecast 2025-2029].
- Goldman Sachs: Maintains a 10% annual return forecast for 2025, aligning with current momentum ([The S&P 500 is Expected to Return 10% in 2025].
Key Risks and Momentum Factor Concerns
Despite optimism, risks persist:
- Momentum Factor Reversal: The iShares MSCI USA Momentum Factor ETF (MTUM) has outperformed the S&P 500 by 10 percentage points YTD. Historical data shows that after such outperformance, momentum stocks typically lag by 3.8% over the next 100 days (per DataTrek’s Jessica Rabe).
- Tariff Uncertainty: While recent negotiations eased tensions, prolonged trade disputes could reignite inflation and growth concerns, as warned in BofA’s April 2025 [Market Brief].
Historical Context and Market Breadth
BofA’s analysis highlights that improving market breadth—a measure of participation across stocks—often signals sustained bull markets. Since 1986, 88% of cases where risk appetite shifted from panic to neutral saw further gains, supporting the case for S&P 500 upside.
Summary and Outlook
The S&P 500 is within striking distance of its all-time high, backed by:
- Institutional optimism (Long Forecast: 6,317 by May; BofA/Goldman long-term targets).
- Easing macro risks (tariff truce, improving sentiment).
Key Forecasts:
| Institution/Source | Forecast Period | Projection | Notes |
|---|---|---|---|
| Long Forecast | May 2025 | 6,317 (+5.93%) | Near-term breakout potential |
| Long Forecast | June 2025 | 6,691 | Exceeds current ATH |
| Bank of America (Dec 2024) | 2025 Year-End | 6,666 | Initial target, later revised downward |
| Goldman Sachs | 2025 | 10% return | Aligns with current trajectory |
Conclusion: While the S&P 500 appears poised to reclaim its record high, investors should monitor momentum stock volatility and geopolitical risks. The path to new highs hinges on sustained macro stability and earnings resilience.


+ There are no comments
Add yours